
Deep Dives
In-depth talks, tutorials, and conference sessions for developers.
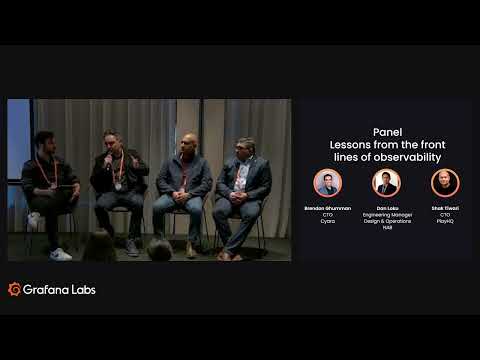
Alert fatigue, AI triage, and incidents: Lessons from observability experts at Cyera, PlayHQ & NAB
PointsBet's Observability 2.0 Journey: Breaking vendor lock-in with OpenTelemetry and Grafana Cloud

What's New in Digital Experience Monitoring with Grafana Cloud

Grafana Tempo: Trace diff & span pruning (August 2026 Community Call)

Grafana Pyroscope: Call Tree, Heat Map, & Adaptive Profiles (August 2026 Community Call)

Introduction To Session Replay | Grafana Cloud Frontend Observability

Grafana Cloud Database Observability

Observability and AI explained - Grafana Labs

Agent Observability Deep Dive Demo | Grafana Cloud

Investigations Arena: how we test Assistant investigations
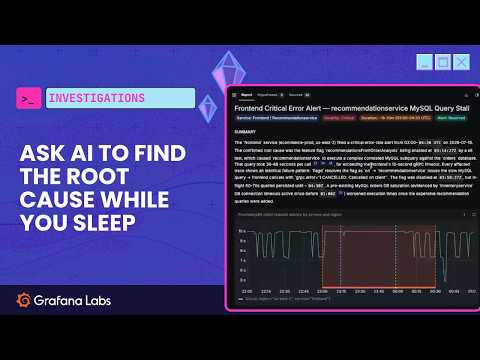
Automatically starting investigations from an alert with Assistant Investigations

Meet GCX: Give Your AI Coding Agent Production Context
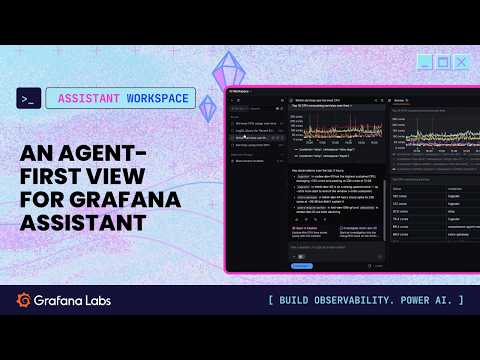
Meet Assistant Workspace: Full-page experience for Grafana Assistant

k8s-monitoring-helm Chart Office Hours (July 2026)
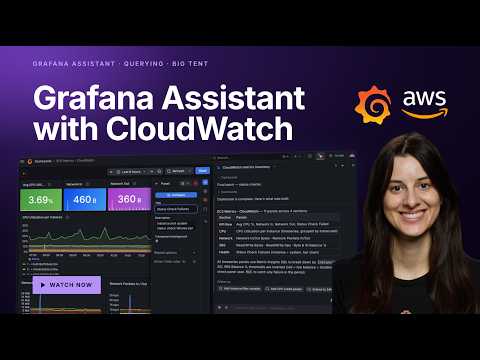
How to use Grafana Assistant with the AWS CloudWatch data source

Grafana Campfire 🔥 Your First OSS Contribution - (Grafana Community Call - July 2026)

How Grafana Cloud Ingests Your Data | Data Sources, Alloy & OTel Explained

Grafana Customer Testimonial - Philip Pencal Alter Domus

Grafana Pyroscope: Intro to Flame Graphs (June 2026 Community Call)

Grafana Tempo: The distributed tracing journey to 3.0 (June 2026 Community Call)

Why Engineers Don't Trust Autonomous AI — 4th Annual Observability Survey | Grafana Labs

AI Observability Deep Dive Demo | Grafana Cloud
