
Deep Dives
In-depth talks, tutorials, and conference sessions for developers.

k8s-monitoring-helm Chart Office Hours (August 2026)
Alert fatigue, AI triage, and incidents: Lessons from observability experts at Cyera, PlayHQ & NAB
PointsBet's Observability 2.0 Journey: Breaking vendor lock-in with OpenTelemetry and Grafana Cloud

What's New in Digital Experience Monitoring with Grafana Cloud

Grafana Tempo: Trace diff & span pruning (August 2026 Community Call)

Grafana Pyroscope: Call Tree, Heat Map, & Adaptive Profiles (August 2026 Community Call)

Introduction To Session Replay | Grafana Cloud Frontend Observability

Grafana Cloud Database Observability

Observability and AI explained - Grafana Labs

Agent Observability Deep Dive Demo | Grafana Cloud

Investigations Arena: how we test Assistant investigations
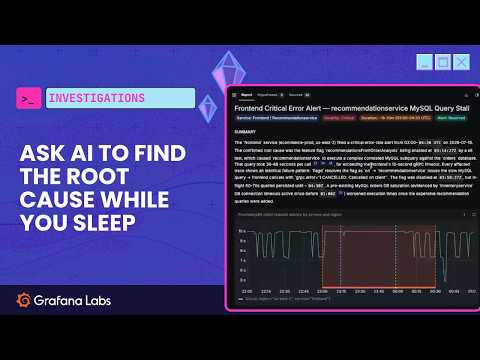
Automatically starting investigations from an alert with Assistant Investigations

Meet GCX: Give Your AI Coding Agent Production Context
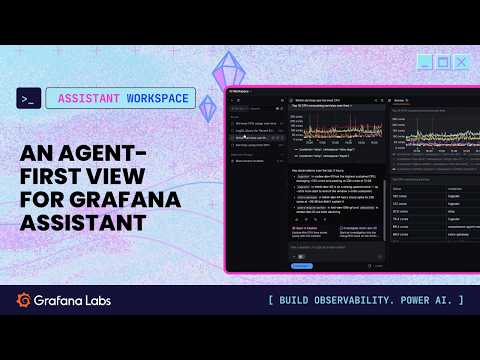
Meet Assistant Workspace: Full-page experience for Grafana Assistant

k8s-monitoring-helm Chart Office Hours (July 2026)
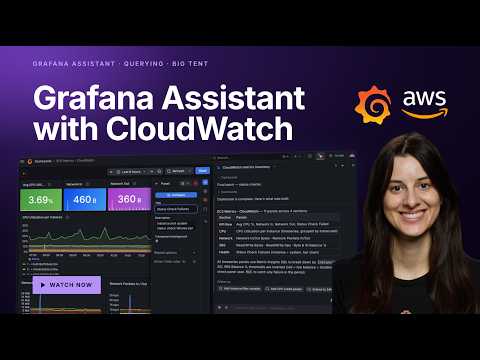
How to use Grafana Assistant with the AWS CloudWatch data source

BigQuery Agent Analytics Looker

20 minutes to 2 minutes: How Home Depot automated incident responses with OpenTelemetry

Architecture for running agents in production

Building an MCP-powered autonomous incident response ecosystem

From prototype to production: 45 minutes to a reliable Gemini Enterprise Agent Platform agent

Scale AI agents in production
